- Wago Products
- Cabur Products
-
Cembre Products
-
Tube terminals - End sleeves
-
Ring - Fork - Pin - Blade terminals
-
Slide cable lug
-
Tube connectors
-
Copper tube crimp lugs
-
Copper single-hole terminal lug for circuit beakers
-
Crimping through/sleeve connectors
-
Aluminum tube crimp lugs
-
Bimetallic tube crimp lugs
-
Terminals in roll
-
Connections for for railway applications
-
Other products Cembre
-
Tube terminals - End sleeves
- Identification and labeling systems
-
Controls
- Pushbuttons - Selectors - Pilot lights
- Limit switches
- Timers
- Counters - Tachometers
- Digital meters-PID Control-Transducer-Converters
-
Monitoring relays
-
1-ph AC/DC voltage monitoring
-
Speed monitor relay
-
3-ph voltage monitoring
-
1-ph current monitoring
-
3-ph current monitoring
-
3-ph monitoring, phase loss-sequence, asymmetry etc
-
Frequency monitoring
-
Power monitoring
-
Power factor monitoring
-
Level control
-
Dry running and pump alternating
-
Motor temperature monitoring
-
Motor monitoring and potection units
-
Temperature - Humidity - CO2
-
Wind
-
1-ph AC/DC voltage monitoring
- Current transformers
-
Earth leakage control
-
Flush mounting earth leakage controllers
-
Internal mounting earth leakage controllers
-
DIN rail mounting earth leakage controllers
-
Earth leakage controllers with incorporated CT
-
Solid-core toroidal current transformers
-
Split-core toroidal current transformers
-
External multiplier for earth leakage controllers
-
Flush mounting earth leakage controllers
- Switching power supplies and Automatic battery chargers
- Surge protection devices
- PLC - Operator panels - Automation units
- Safety modules
-
Automatic transfer switches controllers
- Engine and generator controllers
- Software and applications
-
Sensors
- Temperature
-
Humidity
-
Pressure transmitters
-
Inductive
-
AC - cylindrical - 2 wires
-
AC - DC - AC/DC - rectangular
-
DC - cylindrical - 2 wires
-
DC - cylindrical - 3 wires
-
DC - for cleaning processes with high pressure and temperature - Ecolab
-
DC - for high temperature
-
Special applications (metal face, analog e.t.c.)
-
Namur and amplifiers
-
Presence and direction of vehicles
-
AC - cylindrical - 2 wires
- Magnetic
- Capacitive
-
Photoelectric
-
Diffuse reflective
-
Diffuse reflective Background suppression
-
Retro-reflective
-
Retro-reflective, Polarized
-
For transparent objects
-
Through-beam
-
Through-beam controllers and sensors
-
Color contrast and color points
-
LASER (narrow beam)
-
Fork Sensor
-
Domestic garage door & Industrial gates control
-
Non conductive liquid level sensor
-
Fibre Optic
-
Diffuse reflective
- Ultrasonic
- Connectors and Cable Plugs
- Level control
- Loop detectors
- Environmental (exterior use)
- Air quality (interior use)
-
Motion - Presence detector - Radar
-
Switches
- Plug-in industrial relays
-
Power and auxiliary contactors - Thermal overload relays
- Motor protection circuit breakers
-
Solid state relays
-
Single phase, small dimensions
-
1 pole solid state relays without built in heatsink
-
1 pole solid state relays with built in heatsink
-
With 2 or 3 independent or not switching poles
-
For DC loads
-
With soft start and analog functions
-
Special functions: sensing, communication, protection
-
3 pole solid state relays with built in heatsink
-
3 phases solid state relays without built in heatsink
-
Electronic contactors and reversing contactors
-
Hybrid single and 3-phase solid state relays
-
Heatsink and accessories
-
Single phase, small dimensions
- Soft starters
- Frequency drivers / inverters
-
Motor control and protection Units
- Switch disconnectors and Rotary cam switches
- Miniature circuit breakers - Fuse holders - Residual current operated circuit breakers
-
Automatic transfer switches
- Energy management
-
Installation and Marine products
- Industrial Plugs and sockets
- Interlocked socket outlets
- Enclosures and panels
- Control and Protection
- Lighting
-
Products for exterior installations
- Products for worksite installations
- Products for tunnels
- Explosion-proof products (ATEX)
-
Other Marine Products for Ports, Camping and caravan parks (UNAV)
-
Plugs and sockets (UNAV)
-
Interlocked outlet (UNAV)
-
Connection systems for containers (Lloyd’s)
-
Junction boxes for marine use (UNAV)
-
Control devices and optical signals for marine use (UNAV)
-
Bells, sirens and horns for marine use (UNAV)
-
Lighting fixtures for marine use (UNAV)
-
Distribution turrets for water and electric
-
Fire prevention turrets
-
Plugs and sockets (UNAV)
- Professional electrical tools Cembre
- Access Control & Security Systems
- Explosion-proof products
- Bus (Dupline - Smart House / Building)
- Industrial Networks
- Power factor correction
- Photovoltaics (PV instalations)
- E-mobility
- Stainless Steel lighting systems STRAL
- Omniflow - Smart Cities Solutions
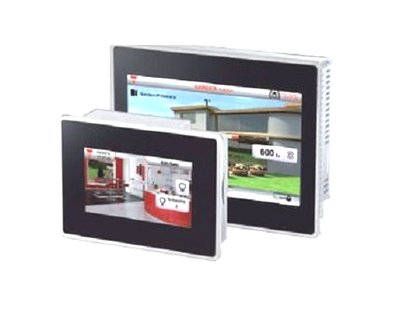
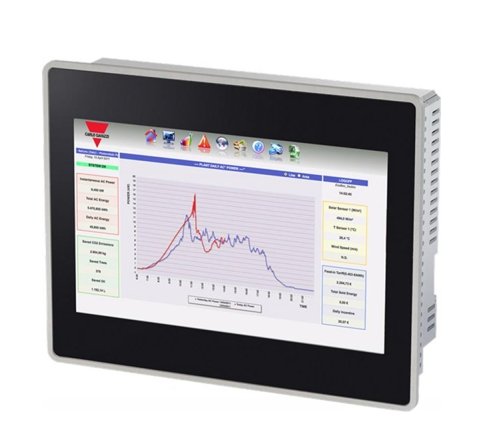
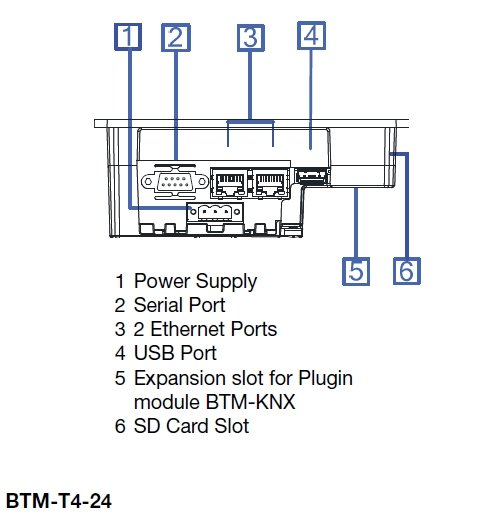
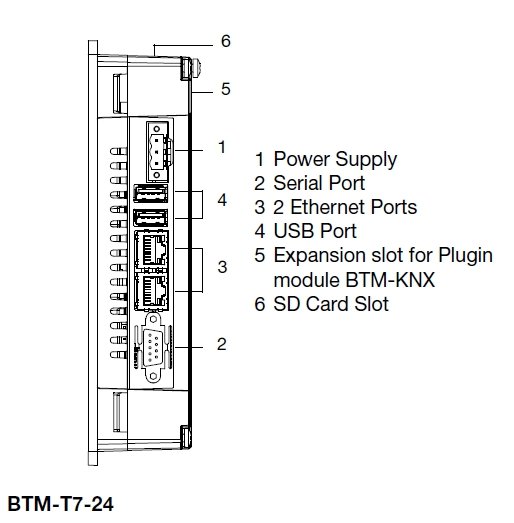
BTM-T4-24, BTM-T7-24
Home automation touchscreen and energy data logger
Product Inquiry
Product Inquiry
DETAILED DESCRIPTION
BTM-T4-24: High-resolution color touch screen 4.3" (compatibility feature with KNX systems)
BTM-T7-24: High-resolution color touch screen 7.0" (compatibility feature with KNX systems)
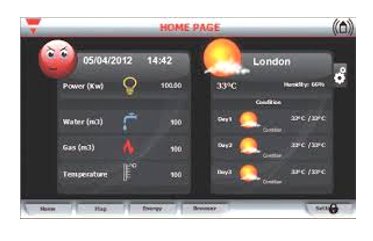
The new SmartHUB display by Carlo Gavazzi is a PC-based control, regulation and logging unit with a brilliant capacitive touch screen. It is three products in one: it is a monitor and logger for photovoltaic plants, a manager for energy in building/home installations and a home-automation display to operate centrally all the functionalities for more comfortable living. Via this touch screen, the user can manage an intelligent control of the building/home, thanks to an intuitive guidance menu that allows quick access to the desired function. Many services are also available, such as e-mail, weather data, camera pictures, diagrams, individual start screens, icons and messages to inform the user about the energy efficiency of the installation
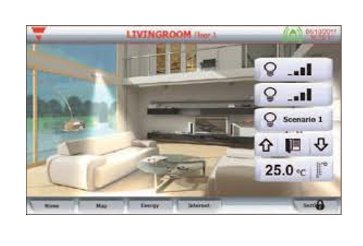
Home automation
SmartHUB lets you have full control of your Carlo Gavazzi home automation system: lights, scenario, rollerblinds, alarms, temperatures, ... are all at your fingertips!
SmartHUB can be connected to the Internet, enabling you to access e-mails and the weather forecast or remotely watch over your home. It can also be linked to external monitoring systems, such as surveillance IP cameras, to monitor parts of a building directly from the touch panel.
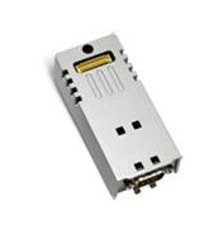
Gateway between Smart Dupline and KNX/EIB bus
The plug-in module BTMKNX provides a gateway between Smart Dupline and KNX/EIB bus
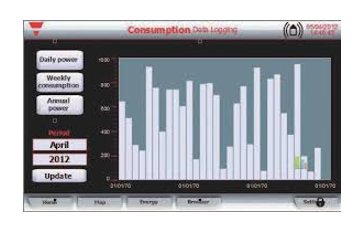
Energy management
SmartHUB logs all the electrical variables collected from Carlo Gavazzi energy meters (EM21, EM24, EM26, WM30). Instant values are shown in a line chart coupled with icons (e.g. emoticons) in order to let the user see and understand the various consumptions. All the logged data is then shown on a bar graph so that a weekly, monthly or yearly overview can be seen by the home owner. The various consumptions of electricity, water and gas are expressed according to the entered tariffs, with the opportunity to manage them divided into 4 time bands.
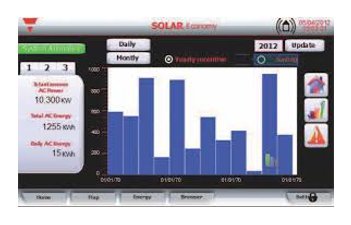
Monitoring of residential solar plants
Innovative, user-friendly and easy to install, SmartHUB is the perfect system for monitoring and managing domestic photovoltaic plants up to 10 KWp. It allows you to monitor all aspects of the system, such as the amount of power produced, the energy yield, the return on investment (ROI) and the control of CO² emissions, storing data for 20 years.
SmartHUB offers a wide range of analysis options (daily, monthly and annual graphs, relative and absolute yields, monetary yields, ...) and sends you an e-mail in case of alarms in the plant.